See it in Wapping Manager
From a dashboard to a decision
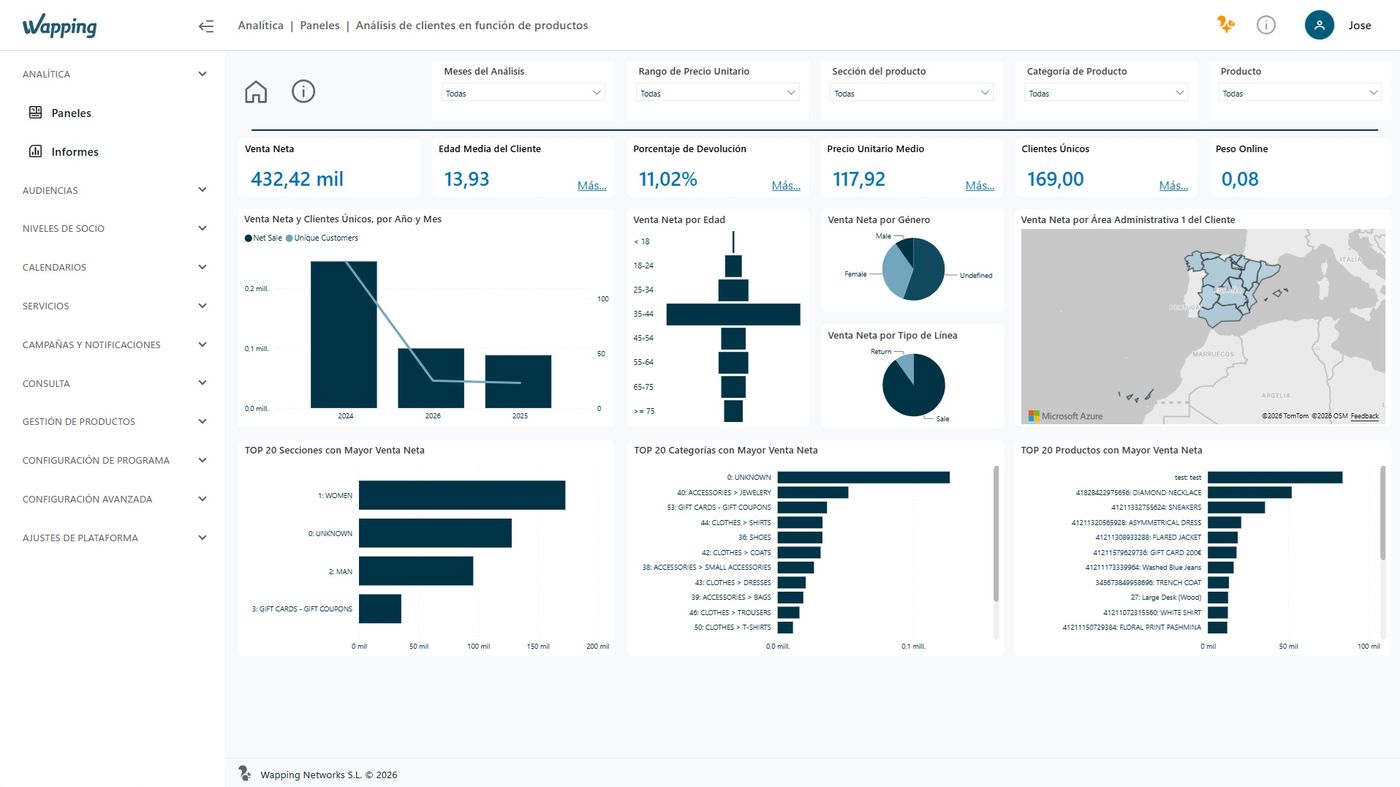
Each report opens with period and store category filters at the top and lets you drill down to the specific product, service, or campaign line.
Loyalty Analytics
The challenge
Without analytics per action, marketing launches a promotion and can only guess whether it worked by looking at the week's overall sales, mixed in with everything else going on in the business. Without a dashboard that isolates the effect of each campaign, service, or program, it's impossible to know which mechanic really moves the customer and which only consumes budget.
How it works
All reports are filtered by period and store category, and each covers a different area of the business.
Illustrative example
This is how Wapping analytics is used to make decisions, not just to look at figures.
Cross-selling analysis, step by step
What it measures
Sales and behavior dashboard
Benefits
Every action must have an impact. Every impact must be measurable.
Impact
+40% purchase frequency
Average increase in transactions per customer who joins the program.Average figure across Wapping's customer base.
25x campaign ROAS
Average return (sales / investment) of activated campaigns.Average figure across Wapping's customer base.
-25% marketing costs
Average reduction when activating with data instead of generic campaigns.Average figure across Wapping's customer base.
See it in Wapping Manager
Each report opens with period and store category filters at the top and lets you drill down to the specific product, service, or campaign line.
Loyalty Analytics
Wapping vs. the traditional approach
| Aspect | Traditional approach | Wapping |
|---|---|---|
| Measuring a campaign | Mixed in with overall sales | Isolated, by specific action or service |
| Data updates | One-off reports, on request | Live dashboards, always available |
| Level of detail | Aggregate figures | Drill down to product, store, or campaign |
| Export | Manual reconstruction | Excel or CSV directly from any dashboard |
Use case — Marketing
Without analytics per action, the decision to repeat a campaign is usually based on intuition or on the month's total sales, which mix too many variables. With Wapping, marketing compares the real ROAS of two similar campaigns, sees their impact on purchase frequency and recurrence, and decides with data which one to scale and which one to retire, instead of repeating the same old campaign out of habit.
Our customers drive us to keep innovating














Frequently asked questions
Eight categories of dashboards: Notifications, Customers, Sales, Services, Product, Product Segment, Customer Segment, and Status. Each category includes several analytical dashboards with in-depth, detailed analysis, each showing its own KPIs filtered by period, store, customer profile, and more.
Yes. Each action, promotion, loyalty program, or service can be analyzed independently, following its complete life cycle: from activation to conversion and the customer's subsequent behavior.
A report that cross-references which product departments are bought together, highlighting the most relevant pairings. From there you can check the audience size with Basket Analysis and create a segment to activate a targeted promotion.
Yes, they can be exported directly to Excel or CSV from any dashboard, and custom reports can also be generated.
We'll show you the Loyalty Analytics dashboards on your own operations.