Request a demo See FAQs

The challenge

You have sales data, but you don't know who is behind it

Sales are usually measured by store, channel, or product, and rarely by customer. Without a single profile and analytics designed around the customer, marketing can't know which profile buys each product, when in the year they come back, how much each group is worth, or whether their best customers are growing or cooling off. Decisions are based on overall totals, and actions go out to the entire customer base.

How it works

The questions about your customers you can already answer

Every analysis starts from each customer's single profile, with their in-store and online purchases unified, and can be filtered by period, store, sales channel, and type of transaction.

Which customer profile buys from me?Which type of product each profile buys, with the net amount and the average age of the buyer.
What do they buy, and what is bought together?Cross-selling matrix and Basket Analysis: which departments are bought together and how many customers buy from one but not the other.
When do they buy?Compare sales across periods to spot trends and seasonality, and drill down from year to month and day.
How much is each customer worth?RFM analysis: score recency, frequency, and monetary value from 1 to 5, and group customers into predefined RFM segments.
How does each segment behave?Performance of each segment and each group of segments: which are the most valuable and what buying patterns they show.
How are my customers evolving?Acquisition, retention since registration or since first purchase, and evolution of customer indicators over the period you choose.
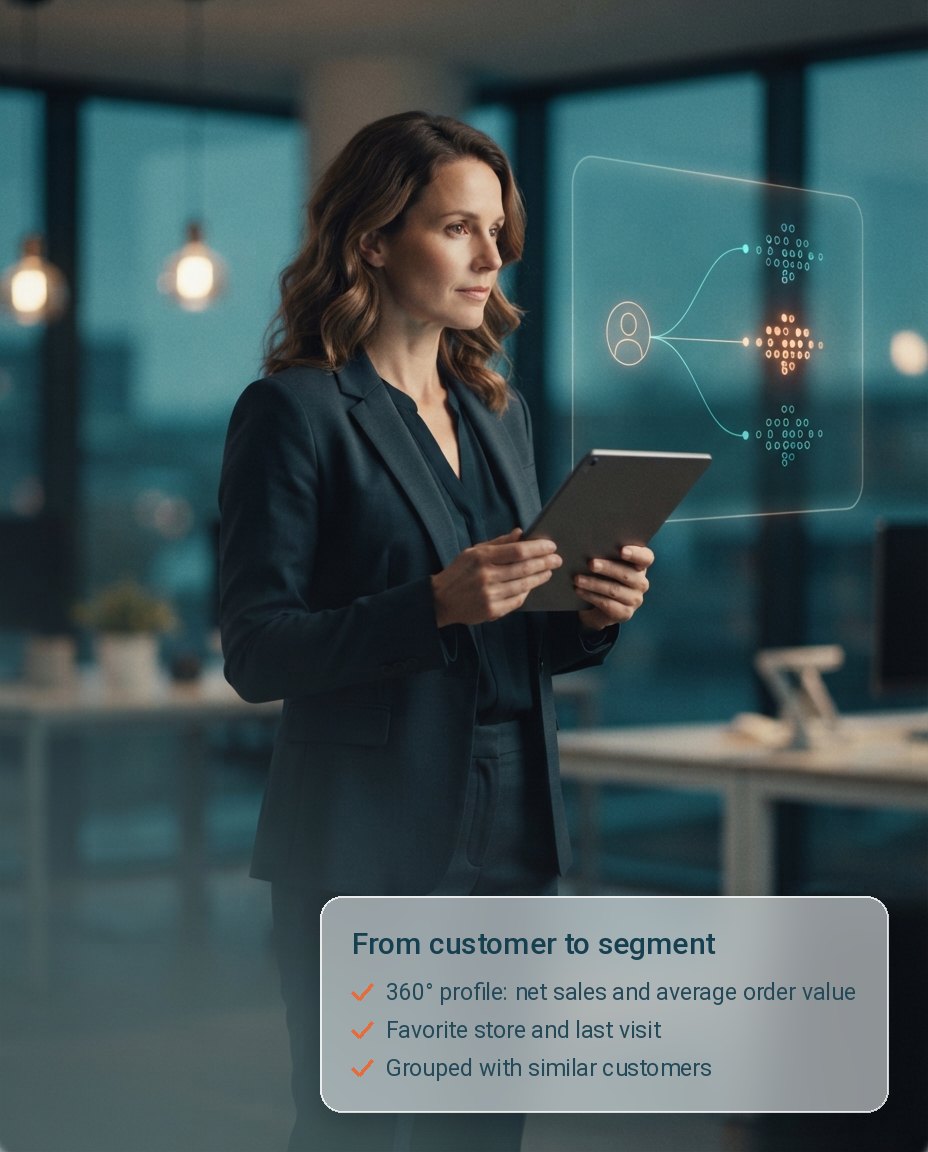
Marketing manager holding a tablet next to a holographic panel where a customer profile connects to groups of customers clustered by purchase behavior

From record to segment

From the individual customer to the group, with the same data

Every purchase, in store and online, feeds the customer's single profile. That's the source of the 360° record, with net sales, average order value, usual store, and last visit, and of the segment analyses that group similar customers together.

See the 360° Customer Profile →
Illustrative example

From a customer who is cooling off to a measured action

This is how Wapping's customer intelligence is used to decide, not just to look at figures.

RFM analysis, step by step

1Detect an at-risk groupRFM analysis shows customers who used to buy a lot and spend well but haven't come back in a while
2Create the segmentAn RFM-based segment brings those customers together and updates itself as their behavior changes
3Refine it with other conditionsCombine it with other criteria, such as province or usual purchase channel, to fine-tune the audience
4Activate a targeted actionA promotion or a loyalty service reaches only that segment, not the entire customer base
5Measure the impactCheck how those customers move within the RFM matrix after the action

What it measures

The customer indicators that come already calculated

Customer record and analysis

Net salesRevenue after deducting returns and discounts.
Average order valueAverage value of purchases in a single transaction.
Units per transactionHow many products the customer buys per transaction.
Online shareShare of revenue generated in digital channels.
Sales by categoryWhich categories they buy most and which need adjusting.
RFM scoreRecency, frequency, and monetary value, from 1 to 5.

Benefits

Every lasting relationship starts with understanding the customer.

  1. Decide based on customer data, not total sales. Discover behavior patterns, preferences, buying habits, and consumption affinities.
  2. Identify your best customers and those who are cooling off. Detect changes in buying behavior and risk signals before they hit your results.
  3. Go from analysis to action without switching tools. The segment you analyze is the same one you use to target promotions and loyalty services.
  4. A consolidated view of all channels. Customers, sales, and behavior, in store and online, in the same report, on a single profile per customer.
  5. Autonomy for marketing. Analyze, create audiences, and activate services in minutes, without depending on another department.

Impact

What your business gains

01

+40% purchase frequency

Average increase in the purchase frequency of customers in the program.Average figure across Wapping's customer base.

02

+20% average spend per customer

Average increase in spend per customer.Average figure across Wapping's customer base.

03

-25% marketing costs

Average reduction when activating with data instead of generic campaigns.Average figure across Wapping's customer base.

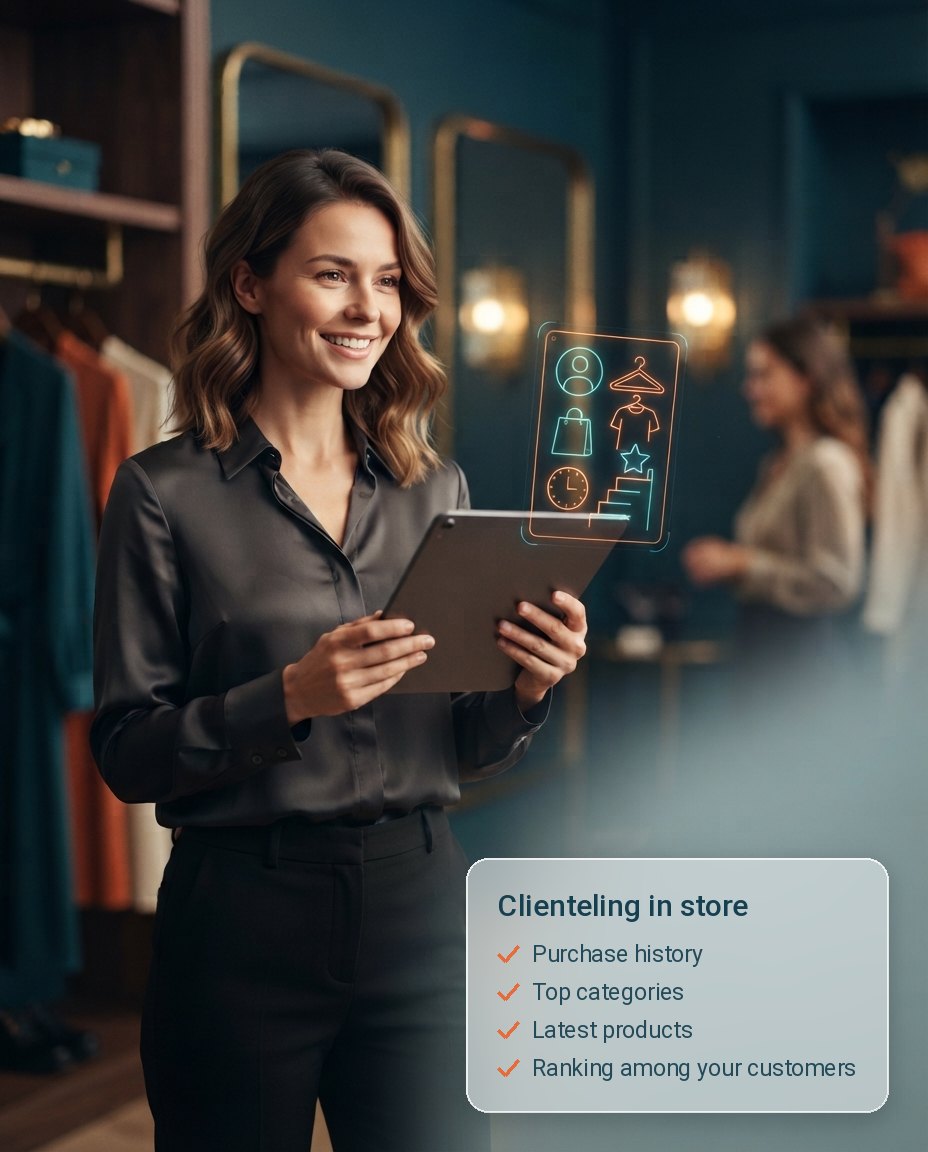
Fashion store sales associate with a tablet and a holographic customer card showing garment, recent-purchase, and customer-importance icons, before serving a customer

In store

Customer intelligence also reaches the counter

With Clienteling, the sales associate checks the customer's purchase history, most-purchased categories, latest products, and ranking against other customers before serving them.

See Clienteling →

See it in Wapping Manager

From customer data to decision

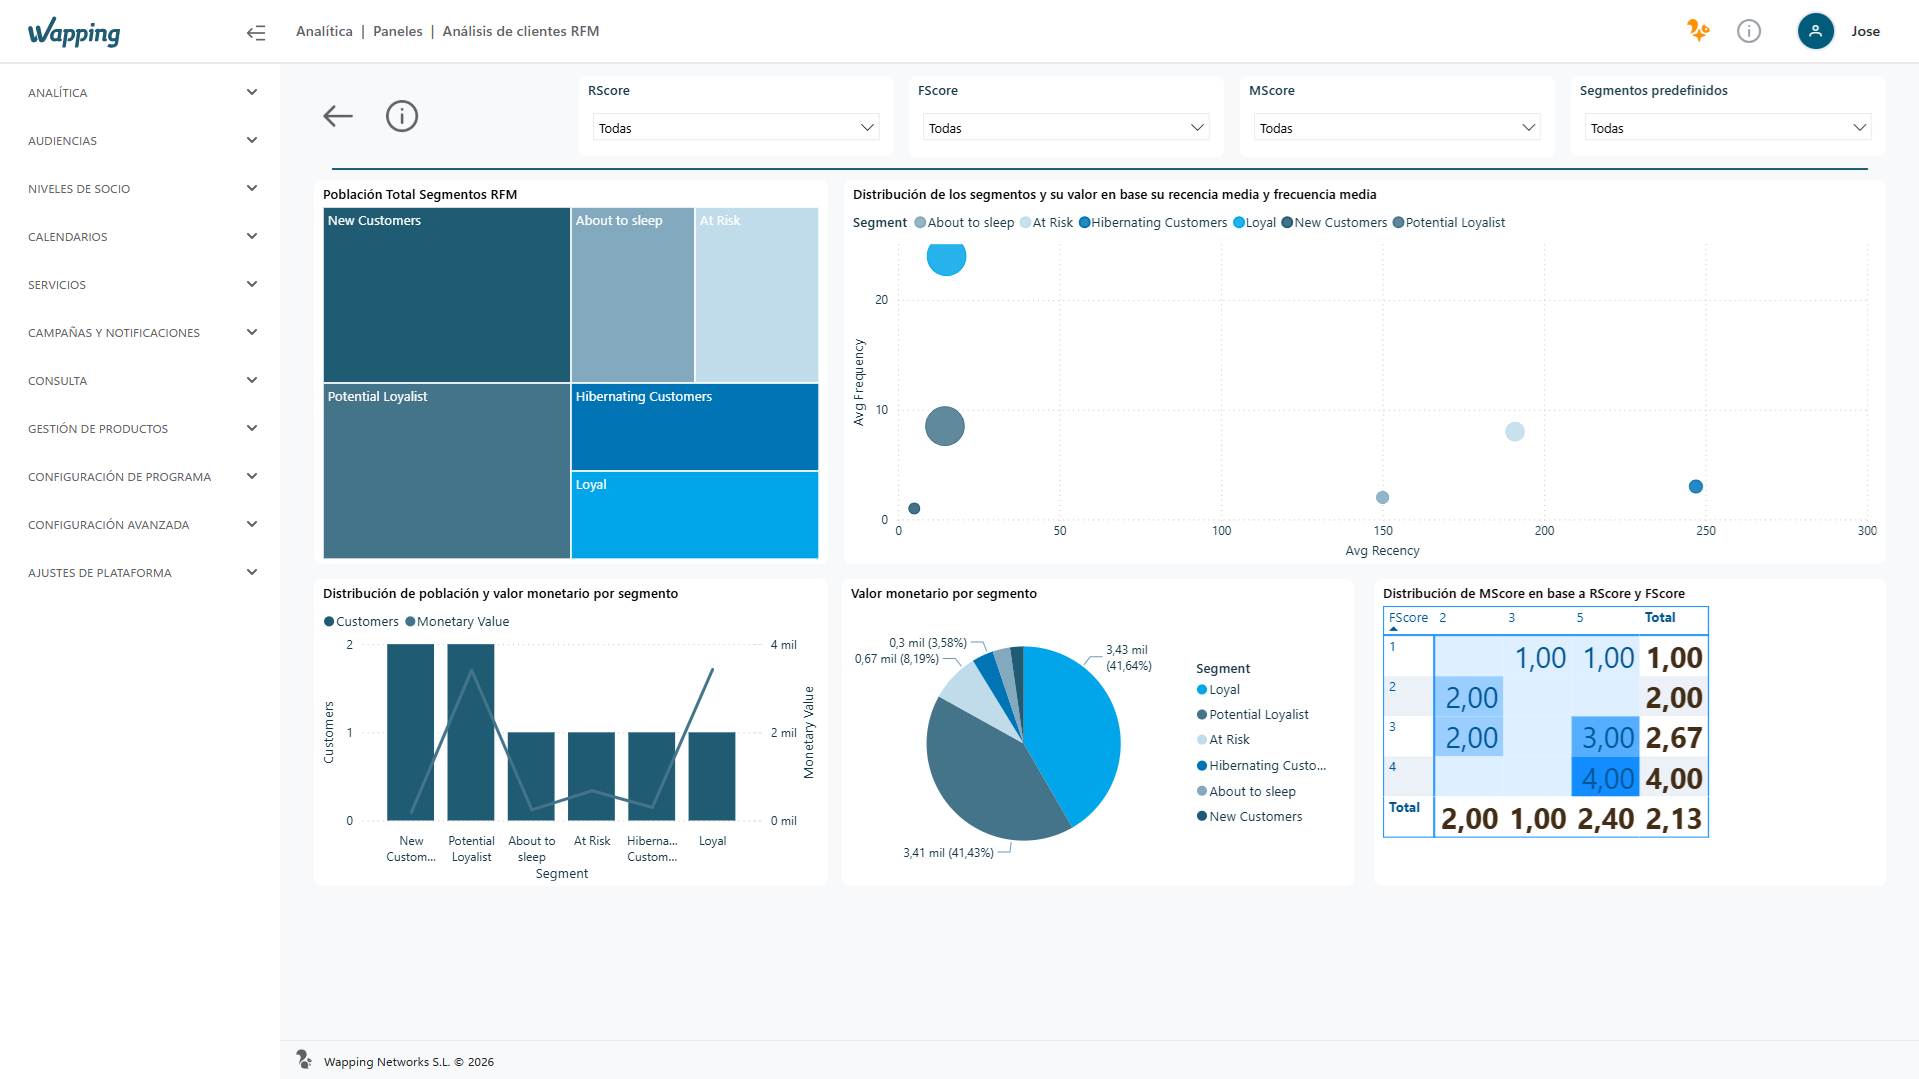
Reports open with filters for period, store, sales channel, and type of transaction, and the charts let you explore the detail: selecting an element filters the rest of the report, and you can drill down to the specific data point.

Wapping Manager RFM customer analysis dashboard: population by RFM segment, average recency and frequency, monetary value by segment, and MScore distribution by RScore and FScore

RFM customer analysis

Wapping Manager – RFM customer analysis

Wapping vs. the traditional approach

From sales by store to knowledge by customer

AspectTraditional approachWapping
Analysis viewpointSales by store, channel, or productSales by customer, profile, and segment
Customer identityThe same customer spread across several recordsA single profile per customer, verified with their mobile number
Customer valueEstimated by hand in spreadsheetsRFM analysis calculated and updated automatically
From analysis to actionExport, cross-reference, and load the data into another toolThe analyzed segment is used directly in promotions and services
Who does itDepends on analysts or ITMarketing analyzes and activates in minutes

Use case — Marketing

Plan the season knowing exactly who you're targeting

Before launching the seasonal campaign, marketing checks which customer profiles buy each category, compares sales with the same period last year, and reviews which RFM segments have lost recency. With that picture, the team decides who to target with each promotion instead of sending the same one to the entire customer base, and then measures how those customers evolve.

Our customers drive us to keep innovating

Silbon logo Sally Beauty logo Mayoral logo Kamado Asian Food logo Avenida Perfumerías logo Perfumerías Facial logo Roberto Verino logo Prissa logo Armas Trasmediterránea logo Gadis logo Sibuya Urban Sushi Bar logo JL logo Pádel Nuestro logo Paco Perfumerías logo Silbon logo Sally Beauty logo Mayoral logo Kamado Asian Food logo Avenida Perfumerías logo Perfumerías Facial logo Roberto Verino logo Prissa logo Armas Trasmediterránea logo Gadis logo Sibuya Urban Sushi Bar logo JL logo Pádel Nuestro logo Paco Perfumerías logo

Frequently asked questions

Your questions, answered

What can I learn about my customers with Wapping's customer intelligence?

Which customer profile buys each type of product (with net amount and average buyer age), which departments are bought together, how sales change between periods, how much each customer is worth according to RFM analysis, how each segment behaves, and how acquisition and retention evolve.

What is RFM analysis and how is it calculated?

RFM scores each customer from 1 to 5 across three dimensions: Recency (how long ago they last bought), Frequency (how many times they have bought in the last 12 months), and Monetary value (how much they have spent in that period). 5 is always the most favorable value. Wapping calculates it automatically from the transaction history.

Can I see how my customers buy at different times of the year?

Yes. Reports can be filtered by period and let you compare product sales across different periods to spot trends and seasonality, and drill down from year to month and day.

Can I use what I discover to launch an action?

Yes. The customer segments you analyze are the same ones used to target promotions, loyalty services, and communications, so going from analysis to action doesn't require exporting or loading data into another tool.

Does the analysis include physical stores and Ecommerce?

Yes. Reports can be filtered by sales channel, store, or store group, and each customer has a single profile with all their purchases unified, in store and online.

Get to know your customers to decide better

We'll show you Wapping's customer intelligence on your own operations.