No customer tells you they’re leaving. They don’t cancel, they don’t complain and they don’t unsubscribe from anything. One month they buy a little less, the next they let a few weeks slip by, and by the time you notice, it’s been six months since they set foot in the shop. That’s why knowing how to identify customers at risk of churn is far more useful than counting how many have already gone.
The good news is that this silent loss leaves a trail in your own purchase data. The bad news is that almost nobody looks at it in time. They look when it’s already too late for a win-back campaign or, worse, when a discount goes to someone who was never going to make it pay. Here’s another way of doing it, with no lists that go out of date and with clear rules based on real behaviour.
It works for a store chain, a restaurant group or any business with repeat customers you can identify.
1. Silent churn: why there’s almost never an explicit churn event
In a subscription business, churn has a date: someone cancels. Retail doesn’t work that way. The customer who drifts away makes no gesture at all; their buying pattern simply cools off. That difference changes everything: if you wait until the churn is obvious, you’ve already lost them. That’s why the retail churn rate, measured as if it were a subscription, always arrives late. By the time churn shows up in the figures, it has already happened.
There’s a second problem. A customer who used to buy every three weeks and now turns up every two months doesn’t stand out in any sales report: their purchases keep adding up, just further apart. To see it, you have to look at the customer, not at the shop.
The causes vary. Some people leave after a bad experience and never say so, some move to a competitor without a word and some simply change their habits. In your data, all three look the same: fewer purchases, further apart, and a history that gradually fades out.

If you’re wondering how to identify customers at risk of churn, start here: the customer has to be identified. Without an individual purchase history there’s nothing to compare, and without comparison there’s no signal.
2. How to identify customers at risk of churn with RFM: the signals you can measure today
You don’t need a crystal ball. You need to decide what behaviour counts as “cooling off” and measure it automatically. These are the signals you can track with the purchase data you already have.
The four RFM states, from “At Risk” to “Lost”
The RFM model scores each customer on three variables: when they last bought (recency), how often they buy (frequency) and how much they spend (monetary value). At Wapping, RFM is calculated continuously, and it produces four states that mark the path towards churn.
- At Risk. A good customer, with medium-to-high frequency and value, who hasn’t bought for a while. They are the hardest to lose and the most profitable to win back.
- About to churn. A customer with medium frequency and value whose pattern is starting to cool off.
- Hibernating. Hasn’t bought for a long time, with low frequency and low-to-medium value.
- Lost. Hasn’t bought for a very long time, with low frequency and low value.
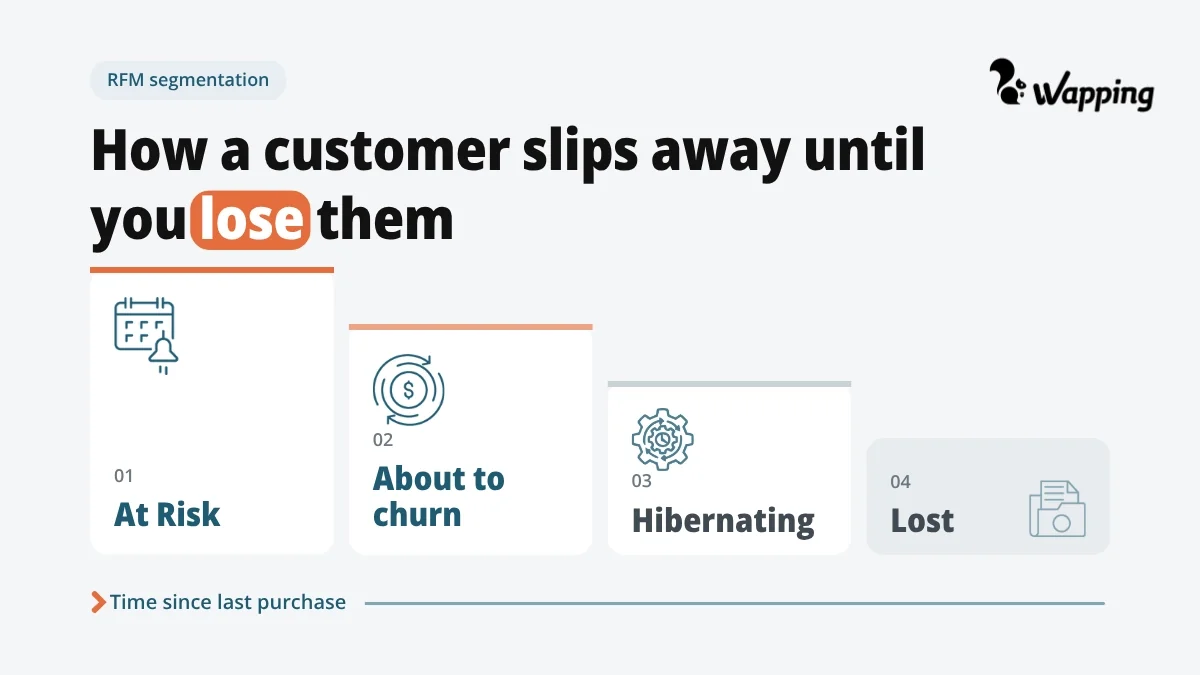
In Wapping’s RFM retail model, the states aren’t calculated from quintiles alone. The system also works with absolute values and with net value, meaning sales minus returns. A customer who buys a lot but returns almost everything isn’t the good customer they appear to be.
How to identify customers at risk of churn when their buying pattern changes
There’s a kind of churn that pure RFM is slow to spot: the customer with a rhythm of their own. The one who buys every year at Christmas, or the one who stocks up in September for back to school.
Wapping lets you build a segment of customers who bought at Christmas last year but haven’t yet this year, and identify customers whose seasonal pattern has changed.
The same applies to loyalty programme tiers: you can spot who is at risk of dropping a tier and act before it happens.
3. RFM segmentation for retail: how to identify customers at risk of churn without lists that go out of date
A list of at-risk customers exported on a Monday is a snapshot, and by Tuesday it’s already out of date. Dynamic segmentation does the opposite: customers move in and out of the segment automatically, based on their behaviour. In some segments the change happens in real time; in others it updates every two hours.
You have two starting points: predefined RFM segments, and the ones you build yourself using the criteria your business sees as a sign of churn. The second is the one that makes the difference, because what “cooling off” means depends on the business: the normal purchase frequency of a café looks nothing like that of a fashion shop.
Once the segment is defined, the promotion and the communication are launched to it. When the customer buys again, they leave the segment automatically, without anyone having to clean up lists. And all of this without raising an IT ticket: marketing defines the criteria and the segment maintains itself.
If you’d like to see how these segments are built step by step, we explain it in our article on dynamic segmentation in retail.
4. Dormancy thresholds: 60, 90 or 120 days, but never on their own
The most common way to label a customer as dormant is the time since their last purchase. At Wapping the threshold is configurable, and the usual windows are 60, 90 and 120 days. The mistake is using it on its own: time without buying is only half the answer.
A customer who hasn’t bought for 90 days could be someone who used to spend €800 a year, or someone who came in once for a promotion and spent €40. It’s an illustrative example, but the point is real: same threshold, very different value. That’s why the rules are combined: days without buying plus the amount spent over another period.
You decide what counts as historical value: spend over the last year, for example, or net value once returns are deducted. What matters is that the whole team uses the same criteria and that they are always applied in the same way.
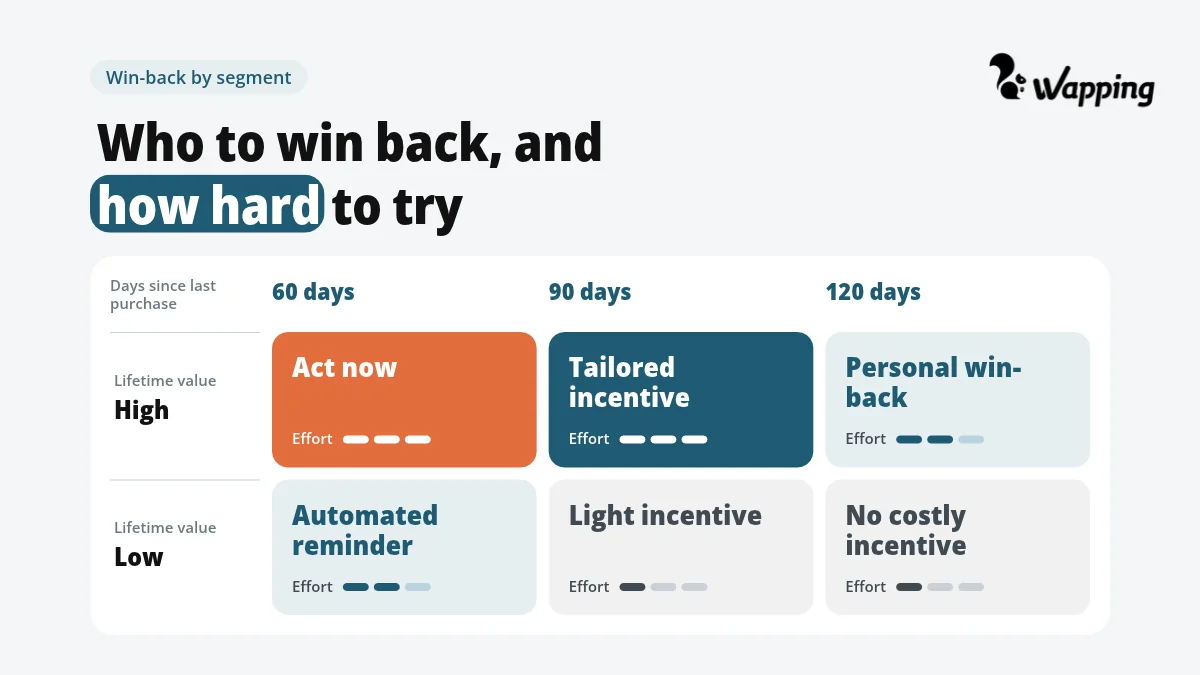
A practical way to read it, as a rough guide:
- High historical value. Worth acting early, in the 60-day window, with an incentive to match.
- Medium value. Standard win-back at around 90 days, with a more modest incentive.
- Low value. Around 120 days; this doesn’t justify an expensive incentive.
And one nuance that challenges a widespread belief: there’s no general point of no return. Some customers written off as lost respond well to win-back. What changes is how much you’re willing to invest in each one.
5. Win-back campaigns for dormant customers: bringing them back without giving away margin
This is where many campaigns lose money: a discount for every dormant customer, without checking whether the resulting sales leave any margin. The approach that works is the opposite: make the incentive conditional, either on a minimum spend, so the basket pays for itself, or on specific categories or products where the margin can absorb the promotional cost.
Three mistakes that cost margin:
- Giving the same discount to the whole dormant base, without distinguishing valuable customers from those who aren’t.
- Looking only at days without buying, without cross-referencing them with what the customer has spent.
- Waiting for the customer to reach Lost. The intermediate states exist precisely so that you can act sooner.
As for channels, what tends to work best is a specific promotion, communicated through one or more channels depending on how many people you want to reach. For a quick result, push or SMS tend to outperform email, and combining more than one is often ideal. WhatsApp suits very specific segments where the channel is already active, rather than a mass send to the whole dormant base.
When the incentive is applied and redeemed at checkout through the headless loyalty & promotion engine, the result is measured directly against the sale: you know how many of the customers you reactivated made a purchase, and at what basket value, with no estimates.
6. Where to start this week
Knowing how to identify customers at risk of churn isn’t worth much if the win-back campaign then gives margin away. If you’re wondering how to reduce churn in retail with data, start with three steps, no project required:
- Set your threshold. Choose the 60-, 90- or 120-day window that makes sense for your customers’ normal purchase frequency.
- Cross-reference it with historical value. Separate the dormant customer who is worth their weight in gold from the one who doesn’t justify the effort.
- Make the incentive conditional. On a minimum spend or on categories with margin, never on the whole base equally.
Once you launch your first campaign, look at which segments responded and adjust the threshold. The first version is rarely the final one.
Identifying customers at risk of churn isn’t about guessing: it’s about rules based on real behaviour, defined by your business and applied automatically. If you’d like to see how it’s configured on a real platform, find out how Wapping works.